![Ving_Logo_TM_-_RGB_-_For_Web.png]](https://support.vingapp.com/hs-fs/hubfs/Ving_Logo_TM_-_RGB_-_For_Web.png?height=40&name=Ving_Logo_TM_-_RGB_-_For_Web.png)
The Analytics dashboard is where all of your training data comes together. Instead of exporting reports into a spreadsheet and trying to sort through the information yourself, Analytics gives you a live view of what's happening across your organization and lets you take action without ever leaving the page.
Think of it as an interactive export. You still get all the data you need, but now you can filter it, organize it, update assignments, and manage training directly from the dashboard.
Start with the big picture
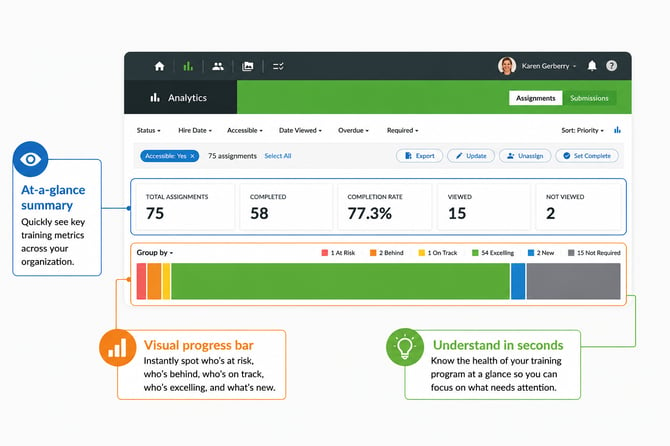
When you first open Analytics, you'll immediately see how your organization is doing. At the top of the page you'll find a quick summary showing your total assignments, how many have been completed, your overall completion rate, and how many assignments have or haven't been viewed yet.
Just below that is a color-coded progress bar that makes it easy to spot who's on track, who's falling behind, who's excelling, and where you may need to step in. Instead of digging through rows of data, you can understand the health of your training program in just a few seconds.
Narrow down exactly what you're looking for
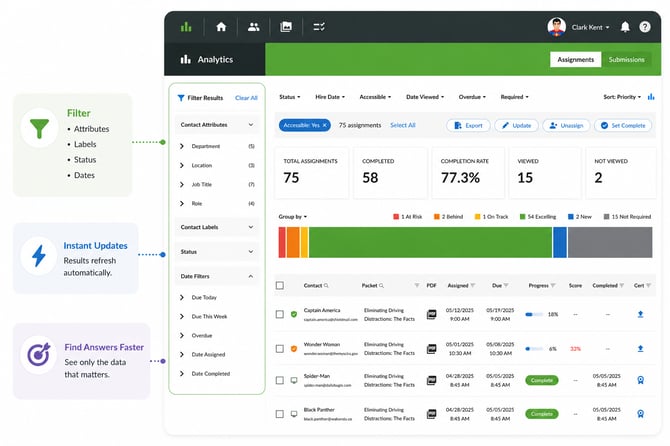
Most organizations don't want to look at every assignment at once. That's why Analytics lets you quickly filter your results.
Need to see only employees in Ohio? Looking for forklift training? Want to check assignments that are overdue or due this week? Simply use the filters on the left and across the top of the page to narrow your results.
As you apply filters, everything updates automatically so you're always looking at exactly the information you need.
Dive into the details
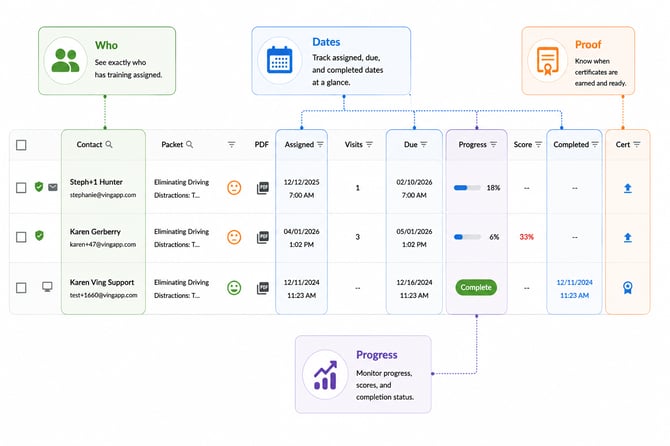
Once you've filtered your results, the assignment list gives you everything you need to know about each learner.
You'll see who the training is assigned to, when it was assigned, when it's due, how far they've progressed, whether they've completed it, their score, and whether a certificate is available.
If someone asks, "Has this employee finished their training?" or "Who still needs this course?" the answer is only a few clicks away.
Take action right from Analytics
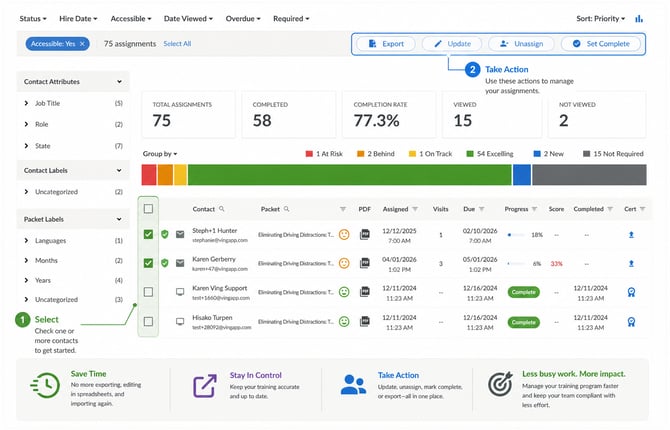
One of the biggest improvements to Analytics is that it isn't just a report—it's a workspace.
After selecting one or more assignments, you can update them, unassign training, mark assignments complete, or export only the information you're looking at.
That means less time downloading spreadsheets and more time actually managing your training program.
Everything you need, all in one place
Whether you're preparing for an OSHA inspection, checking training compliance, or simply seeing how your team is progressing, Analytics gives you one central place to do it all.
Instead of jumping between reports or exporting data into Excel, you can see what's happening, answer questions quickly, and take action immediately—all from one dashboard.