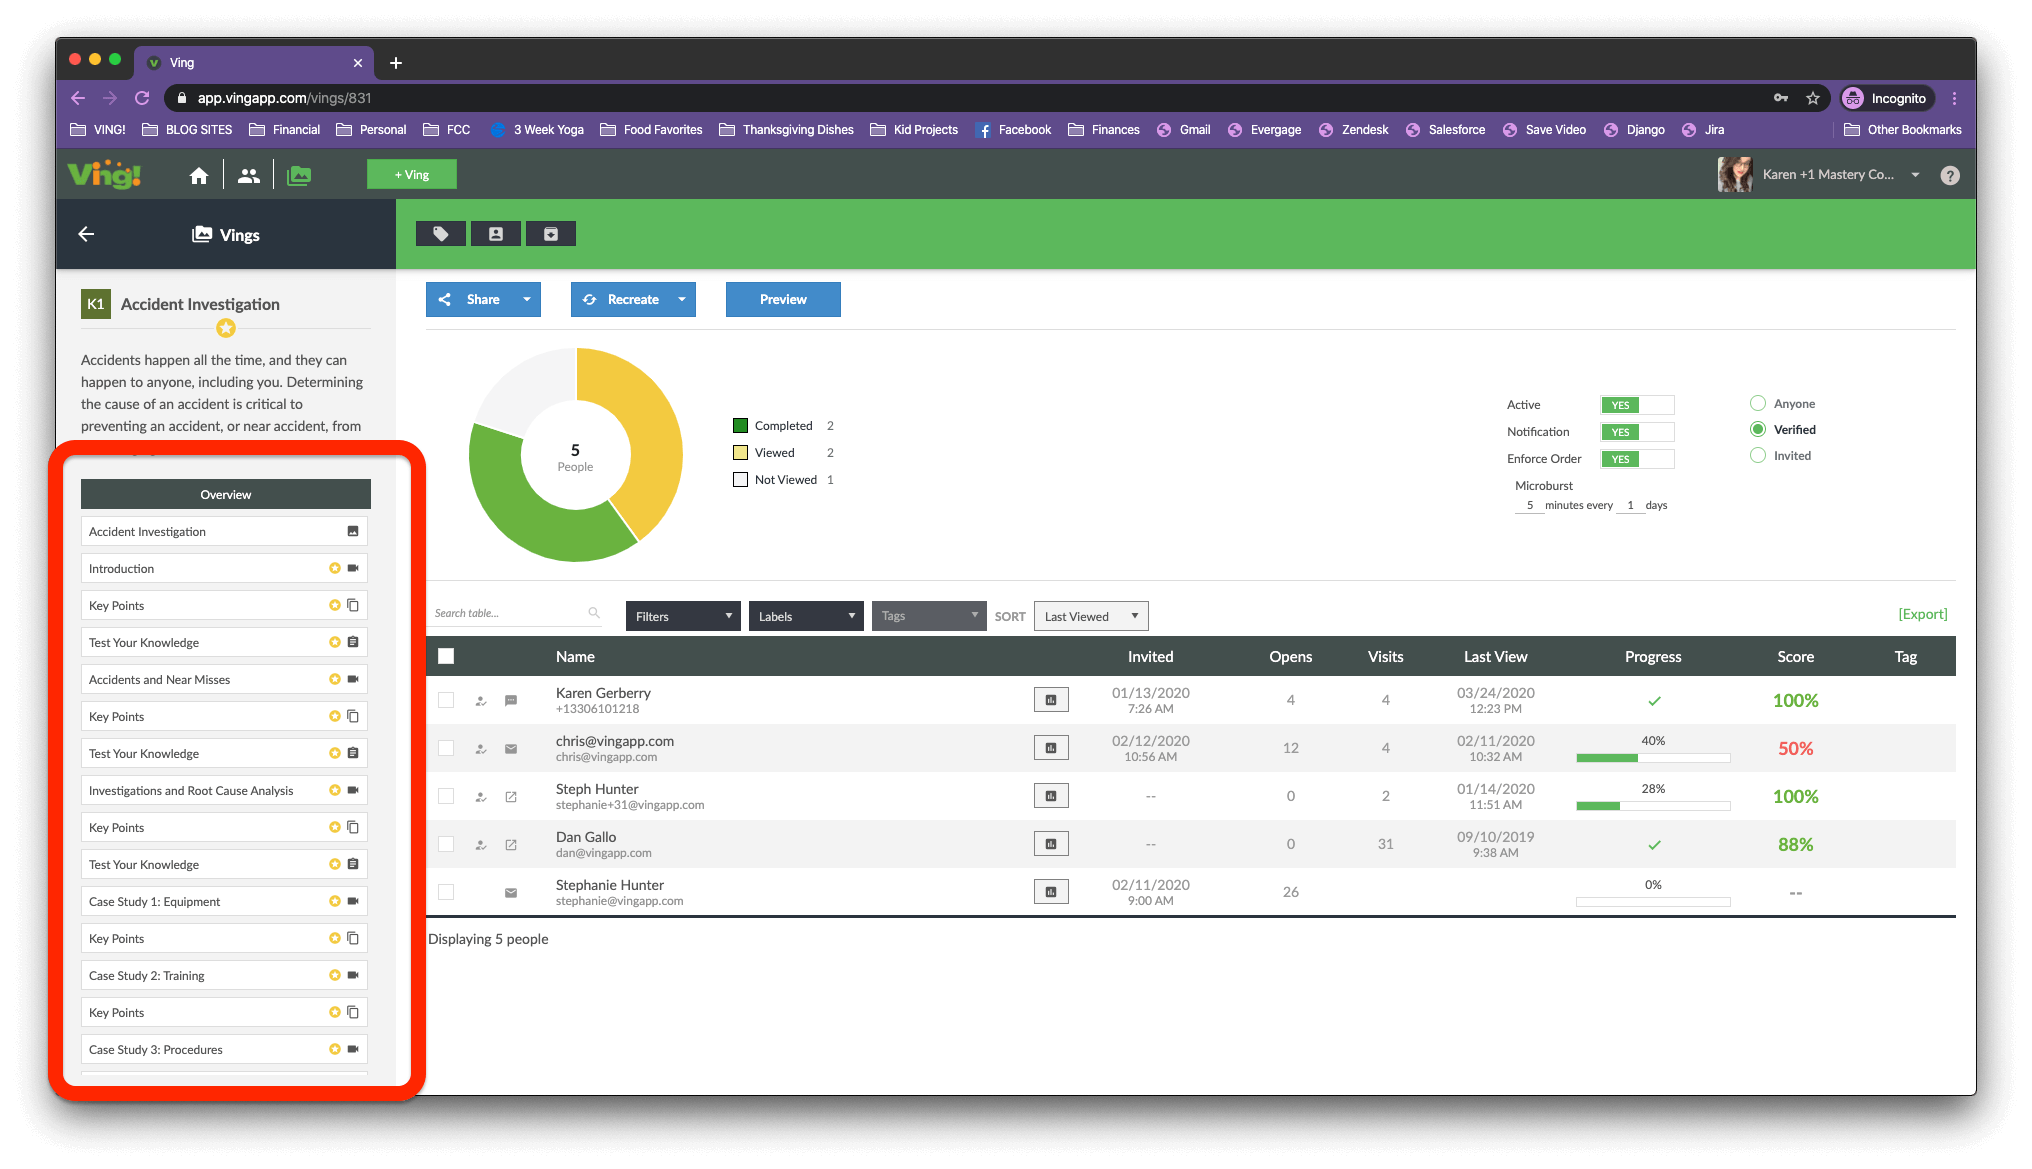
This is your ving details screen. All of the analytics about a specific ving can be found here.
The top graph shows quickly how people are moving through your ving.
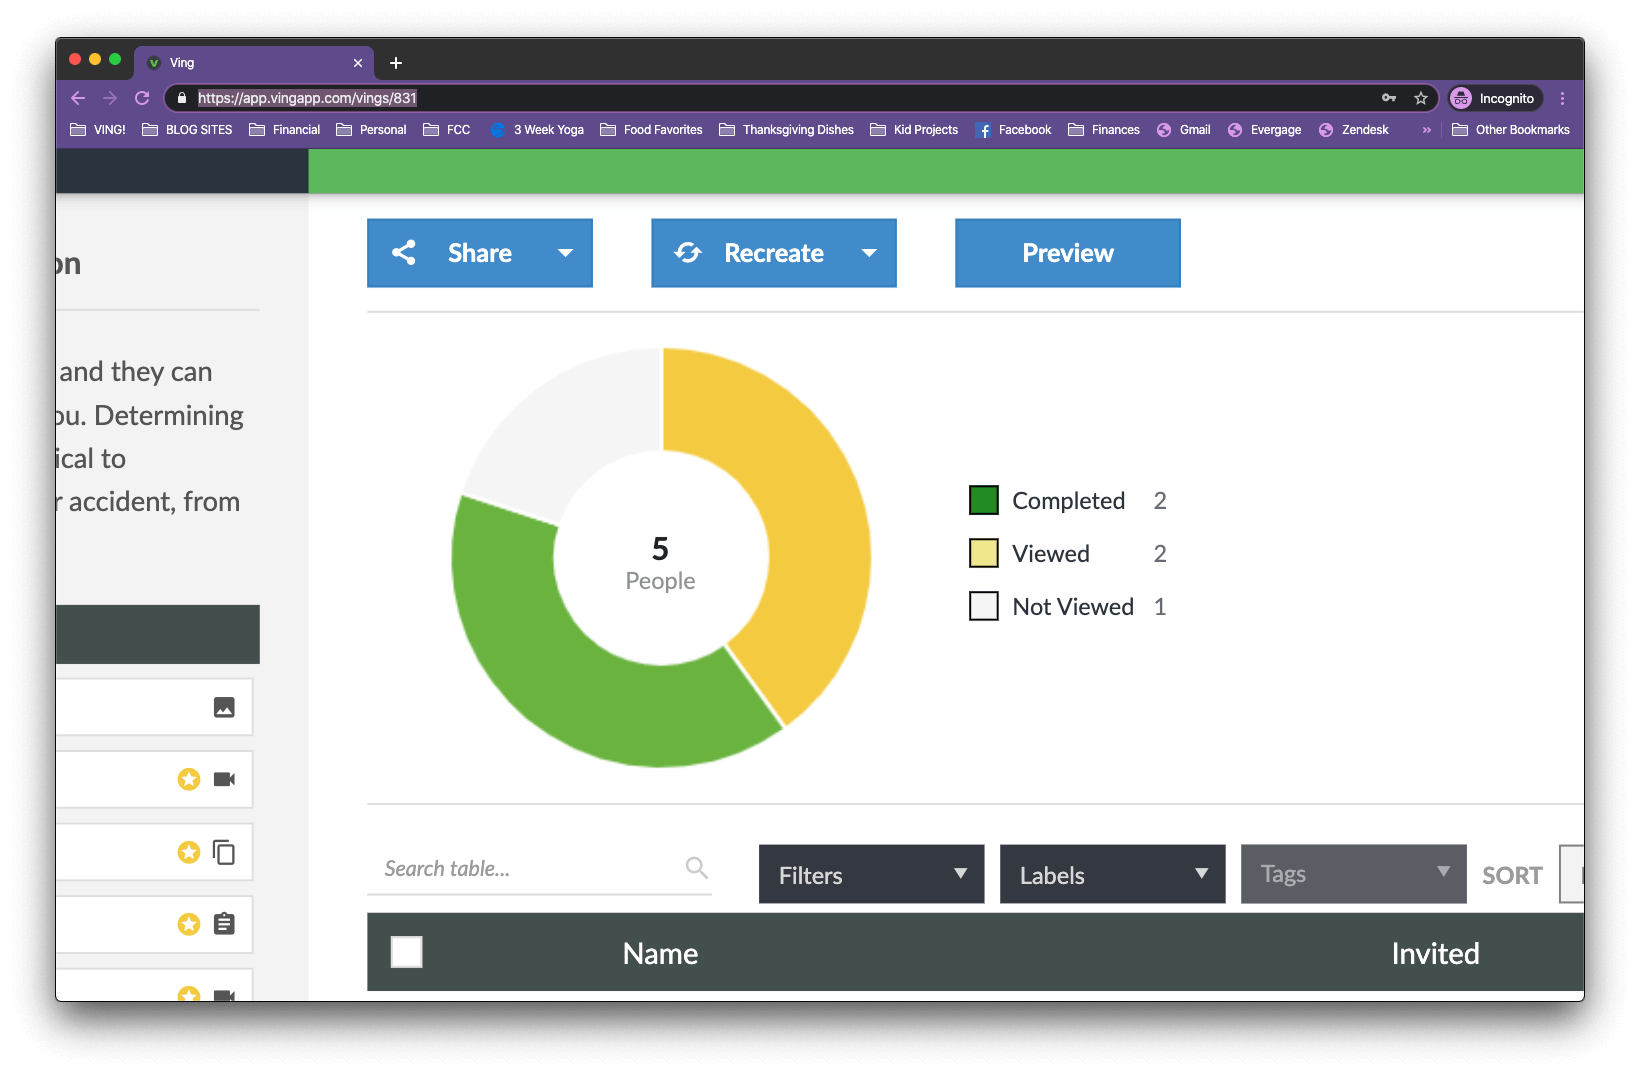
Completed: The number of people who have completed more than 90% of the ving.
Viewed: The number of people who have started but not completed this ving.
Not Viewed: The number of people who have not started this ving.
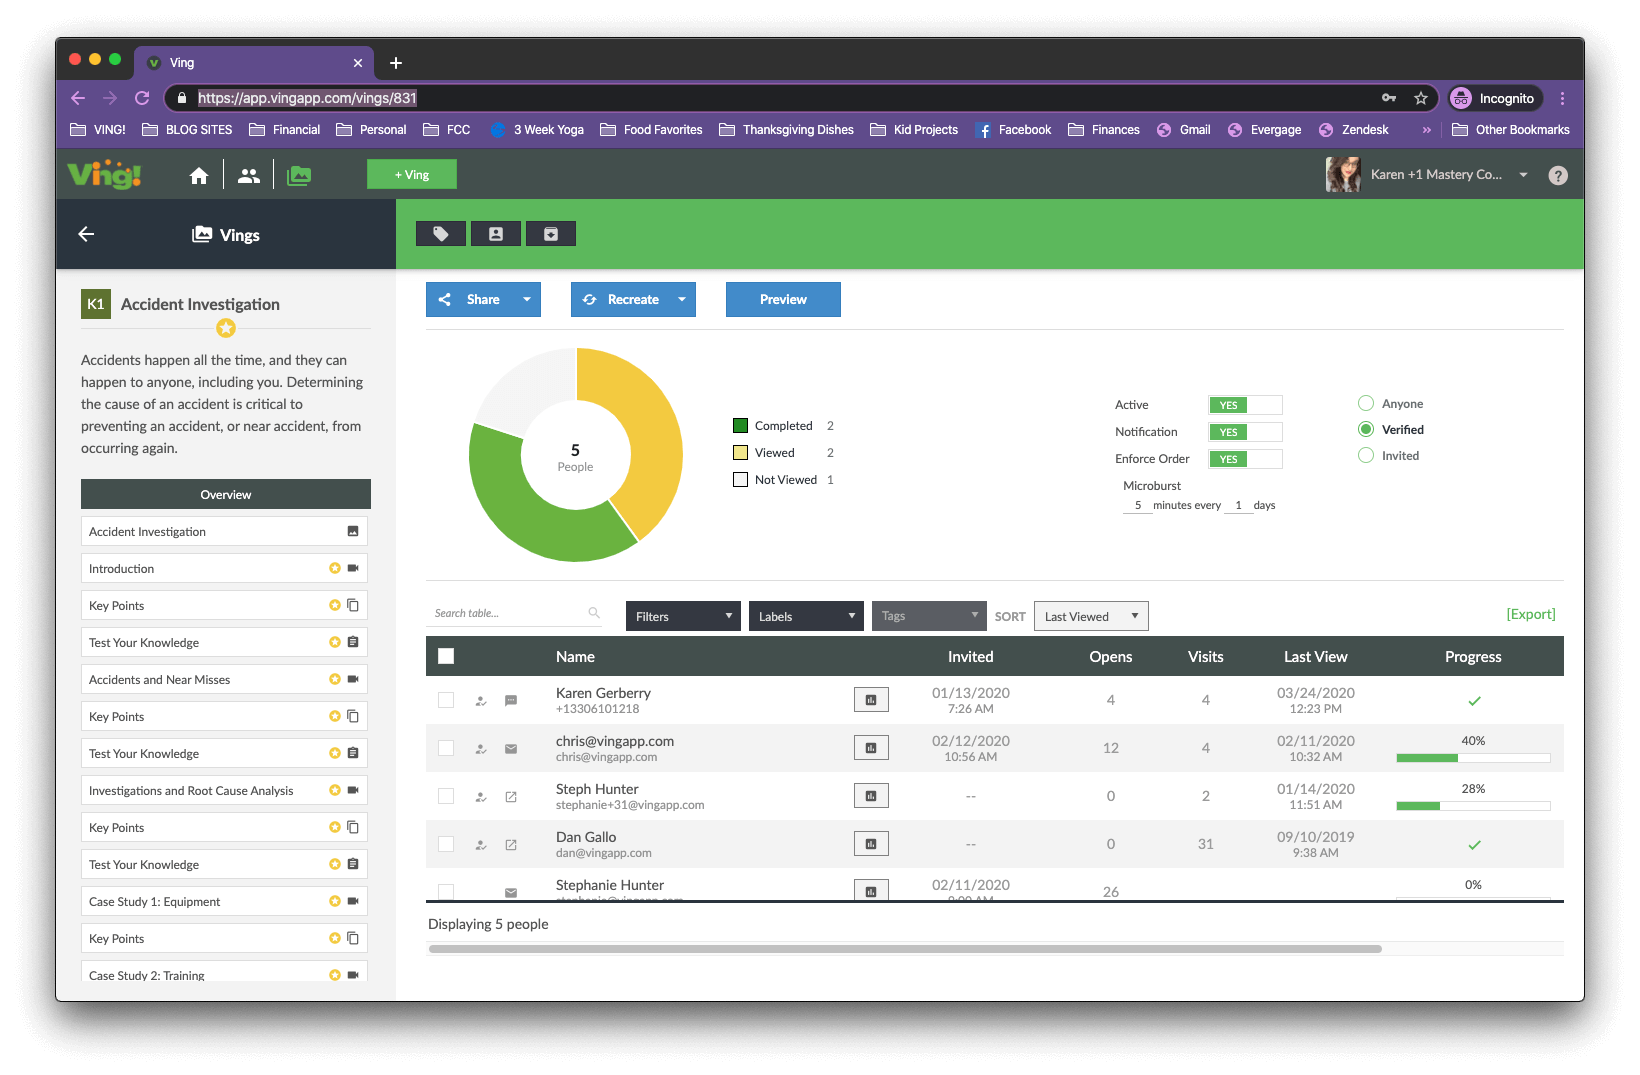
If we move down to the viewer area below the ving. This allows you to dive in a little deeper.
Person Icon With Checkmark: This means the person was logged into a ving account while viewing this ving.
Email/Text/Link Icon: This shows how someone got to this ving.
Name: This displays the name and contact method used to view this email.
Graph Icon: This will allow you to save the Printable Report for this person for this ving.
Invited: This is the date and time that they were last invited and/or reminded about this ving.
Opens: This is the number of times that the person opened the email invitation. Email invitations are tracked by an invisible tiny pixel in the email. If someone does not have their images displayed they will not get tracked for opens.
Visits: This is the number of times someone has visited this ving.
Last View: This is the last date and time that they viewed the ving.
Progress: This is the percentage of the ving that someone has done. If it is a green checkmark that means they did 100% of the ving.
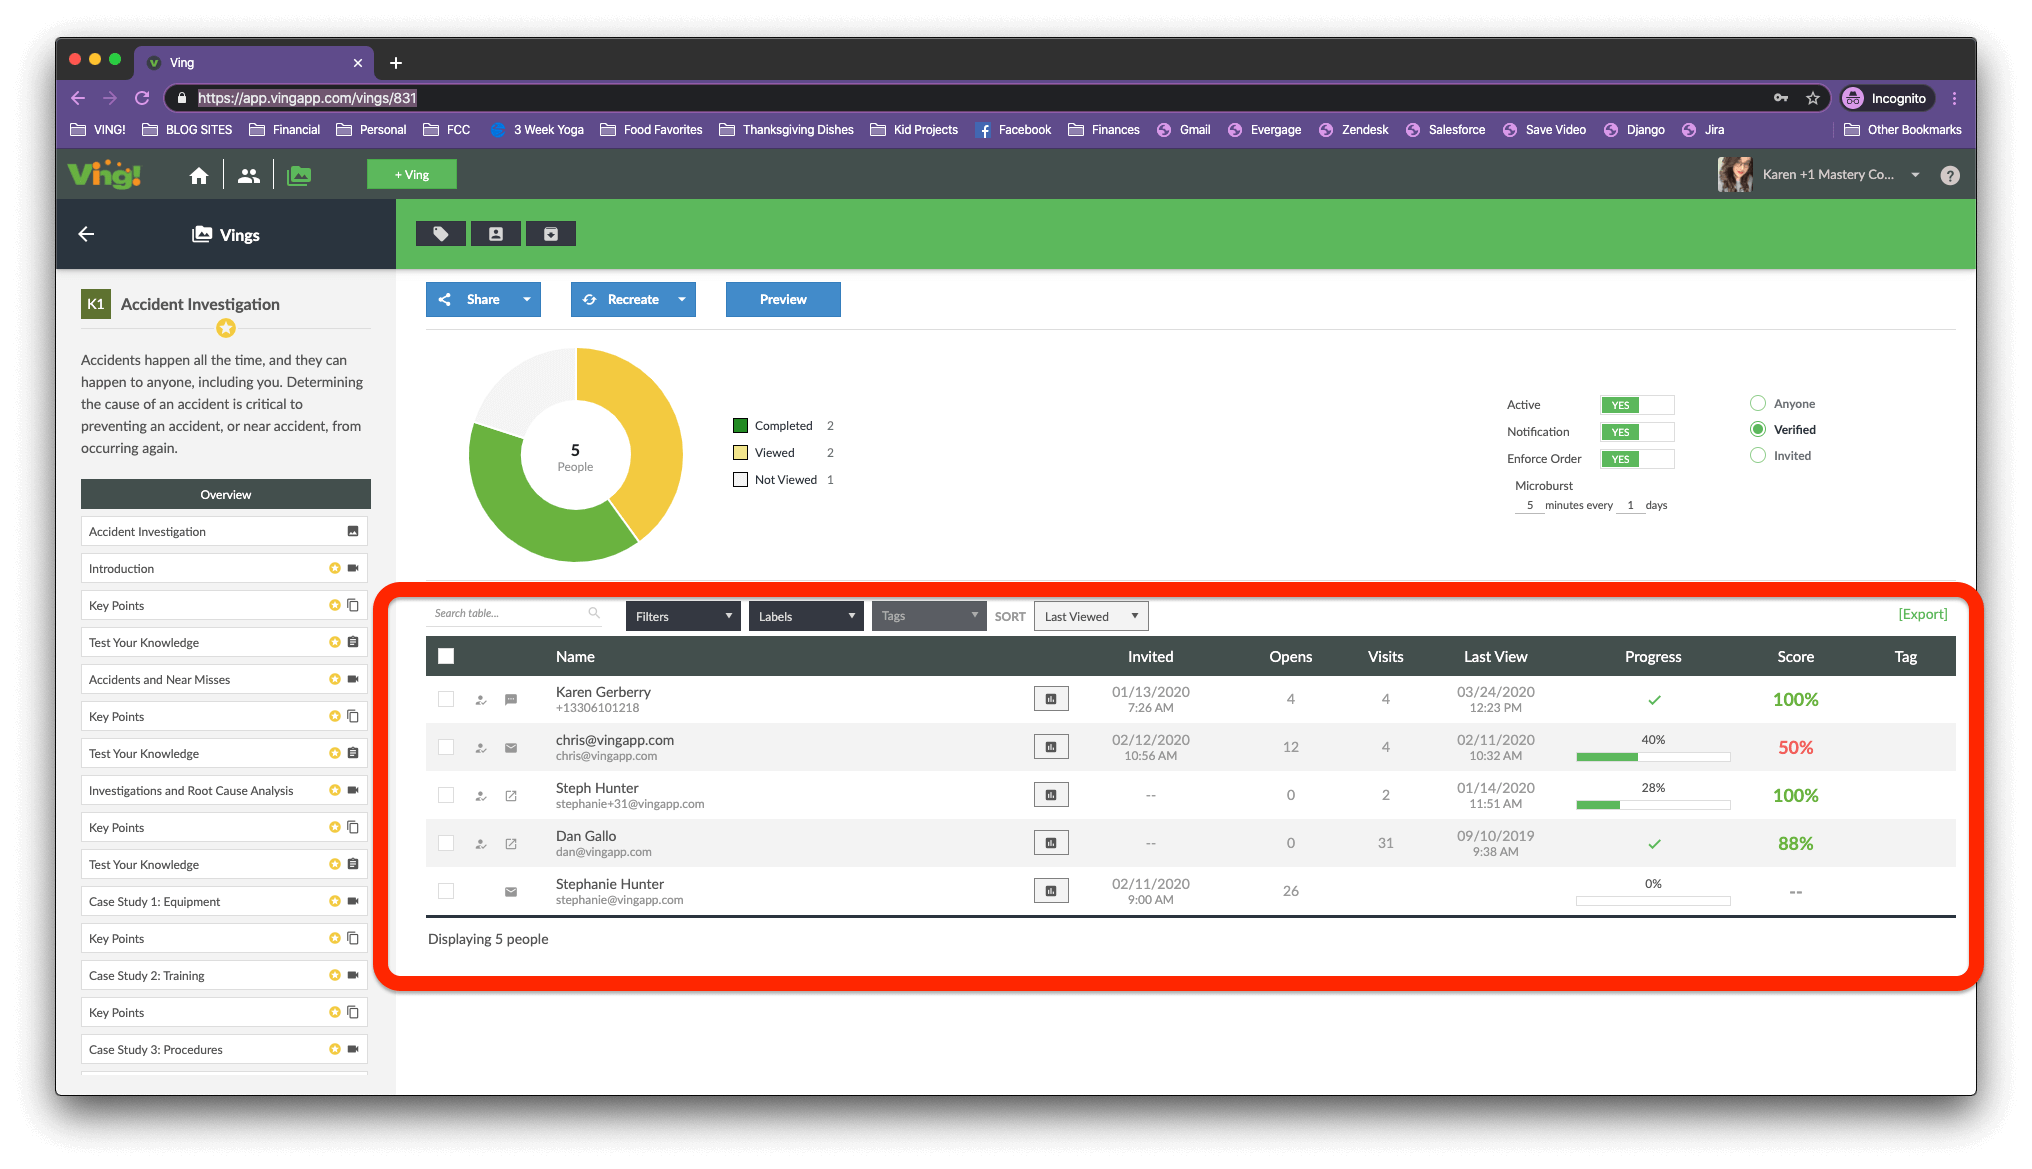
Score: This is the score that someone has received from all of the scored question sets in this ving.
Green - Above 80%
Yellow - 79% - 60%
Red - Below 60%
Tag: This will display the last tag someone used to access this ving. Tags can be added to the end of a short URL to improve analytics when sharing via link.
As you click through each component along the left you will dive deeper into each set of analytics. All analytics explained above will work the same on the component views as well.